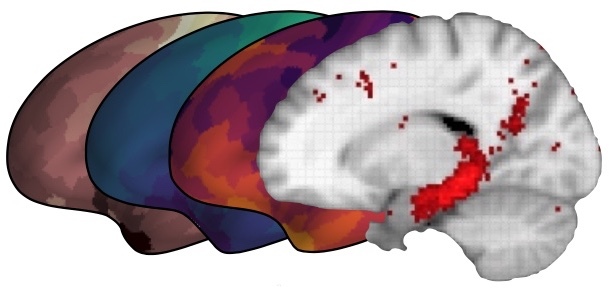
Exploring the Data#
In this notebook, we’ll explore the dataset included with Herculano-Houzel et al. (2015) “Mammalian Brains Are Made of These”.
import pandas as pd
import numpy as np
import matplotlib.pyplot as plt
import seaborn as sns

# Get the data from the "raw" version of the file hosted on our GitHub
!wget https://raw.githubusercontent.com/NeuralDataScience/NeuralDataScience.github.io/refs/heads/master/Data/species_brainmass_neurons.csv

# Open the csv and assign to a dataframe called "data"
data = pd.read_csv('species_brainmass_neurons.csv')
data.head()
--2025-11-25 13:01:03-- https://raw.githubusercontent.com/NeuralDataScience/NeuralDataScience.github.io/refs/heads/master/Data/species_brainmass_neurons.csv
Resolving raw.githubusercontent.com (raw.githubusercontent.com)... 2606:50c0:8002::154, 2606:50c0:8003::154, 2606:50c0:8000::154, ...
Connecting to raw.githubusercontent.com (raw.githubusercontent.com)|2606:50c0:8002::154|:443...
connected.
HTTP request sent, awaiting response...
200 OK
Length: 3649 (3.6K) [text/plain]
Saving to: ‘species_brainmass_neurons.csv.6’


          species_b   0%[                    ]       0  --.-KB/s
species_brainmass_n 100%[===================>]   3.56K  --.-KB/s    in 0s

2025-11-25 13:01:03 (15.5 MB/s) - ‘species_brainmass_neurons.csv.6’ saved [3649/3649]
| Species | Order | cortex_mass_g | Neurons | Other_cells | Neurons_mg | Other_cells_mg | Source | |
|---|---|---|---|---|---|---|---|---|
| 0 | Sorex fumeus | Eulipotyphla | 0.084 | 9730000 | 9290000 | 116727 | 111754 | Sarko et al., 2009 |
| 1 | Mus musculus | Glires | 0.173 | 13688162 | 12061838 | 78672 | 68643 | Herculano-Houzel et al., 2006 |
| 2 | Blarina brevicauda | Eulipotyphla | 0.197 | 11876000 | 15820000 | 60214 | 80729 | Sarko et al., 2009 |
| 3 | Heterocephalus glaber | Glires | 0.184 | 6151875 | 8398125 | 33374 | 45894 | Herculano-Houzel et al., 2011 |
| 4 | Condylura cristata | Eulipotyphla | 0.420 | 17250000 | 32010000 | 40777 | 76995 | Sarko et al., 2009 |
One of the first steps in data exploration is checking the shape of the dataset:
data.shape
(38, 8)
data.columns
Index(['Species', 'Order', 'cortex_mass_g', 'Neurons', 'Other_cells',
       'Neurons_mg', 'Other_cells_mg', 'Source'],
      dtype='object')
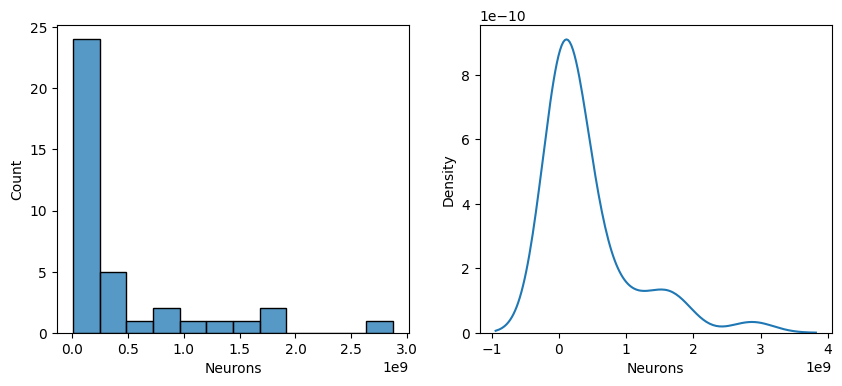
fig,ax = plt.subplots(1,2,figsize=(10,4))
sns.histplot(data['Neurons'],ax=ax[0])
sns.kdeplot(data['Neurons'],ax=ax[1])
plt.show()
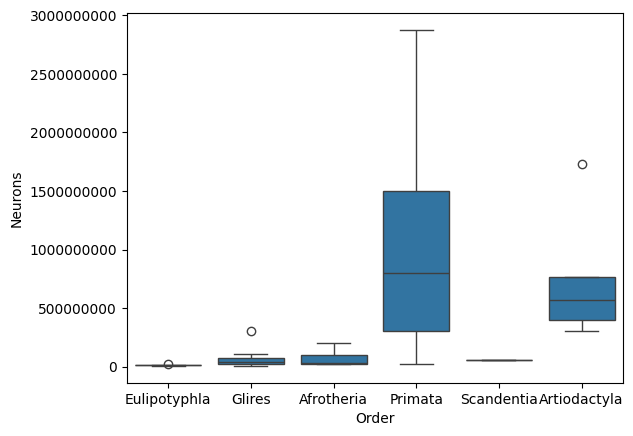
sns.boxplot(data=data, x='Order', y='Neurons')
plt.ticklabel_format(style='plain', axis='y')  # Disable scientific notation
plt.show()
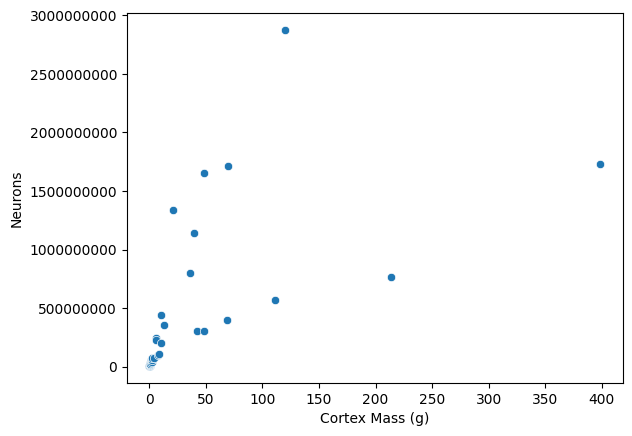
sns.scatterplot(data=data, x='cortex_mass_g', y='Neurons')
plt.ticklabel_format(style='plain', axis='y')  # Disable scientific notation
plt.xlabel('Cortex Mass (g)')
plt.show()
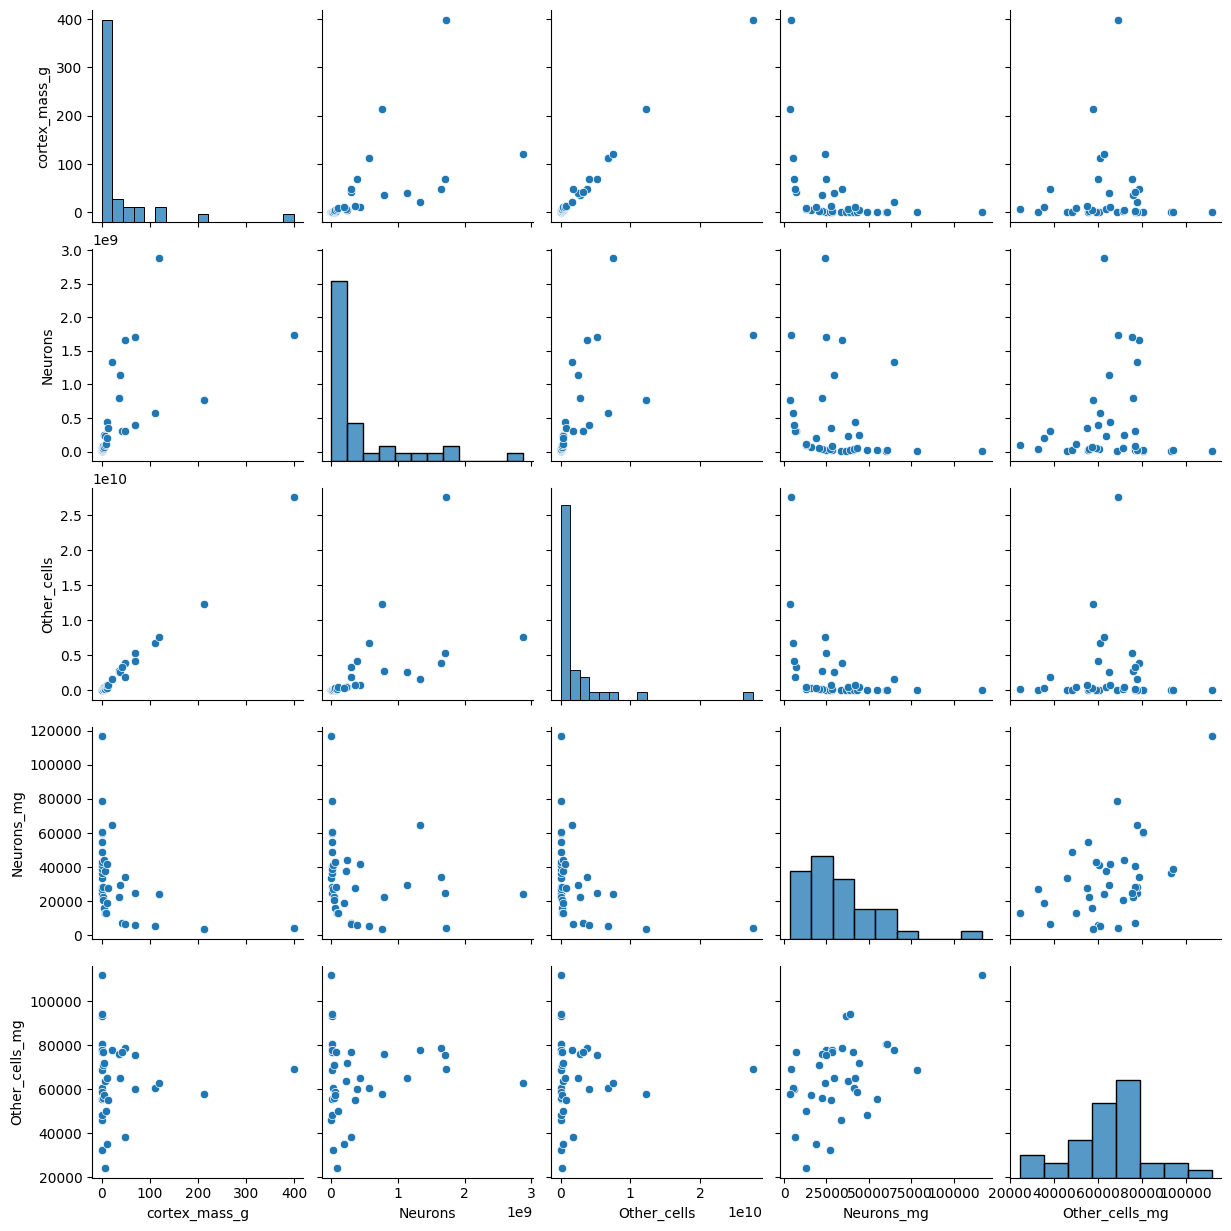
sns.pairplot(data)
plt.show()
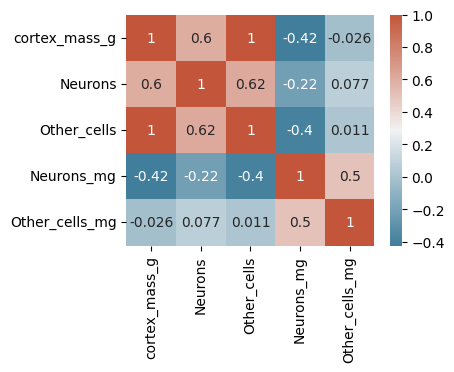
# Compute the cross correlation
corr = data.corr()

# Create axes, colormap, and plot a heatmap
fig,ax = plt.subplots(1,1,figsize=(4,3))
cmap = sns.diverging_palette(230, 20, as_cmap=True)
sns.heatmap(corr,cmap=cmap,annot=True)

plt.show()
/var/folders/xf/zpnqd_3d3m77t0w3b54_8ls80000gp/T/ipykernel_83049/619943810.py:2: FutureWarning: The default value of numeric_only in DataFrame.corr is deprecated. In a future version, it will default to False. Select only valid columns or specify the value of numeric_only to silence this warning.
  corr = data.corr()
Bonus Challenges#
Can you use the NCBI esearch tool to look up information about the Herculano-Houzel et al. 2015 paper for this dataset?